State · Secondary · Co-ed · Western Suburbs
Kenmore State High School catchment house prices
The Kenmore State High School catchment covers 10 suburbs. The median house price across the zone is approximately $1,355,000, ranging from around $1,050,000 in Moggill to $2,255,000 in Pullenvale, on modelled and recently published estimates. Catchment houses move an average of +5.1% year-on-year.
Median house in the catchment
$1,355,000
↑ across 10 suburbs
Entry suburb · Moggill
$1,050,000
— lowest median in the zone
Average YoY growth
+5.1%
↑ year on year
Why the Kenmore SHS catchment matters for house prices
In Brisbane, a strong state-school catchment is one of the few price drivers a buyer can’t renovate their way into — you either own inside the zone or you don’t. That scarcity is exactly why houses on the right side of a Kenmore SHS boundary carry a premium, and why that premium tends to be resilient when the wider market cools. The suburbs below make up the Kenmore State High School catchment; the table runs cheapest to dearest so you can see the full price ladder inside the zone.
| Suburb | Median house | Median unit | YoY |
|---|---|---|---|
| Moggill | $1,050,000 | $580,000 | +6.0% |
| Bellbowrie | $1,050,000 | $580,000 | +6.0% |
| Kenmore Hills | $1,300,000 | $620,000 | +5.5% |
| Anstead | $1,300,000 | $620,000 | +5.5% |
| Pinjarra Hills | $1,300,000 | $620,000 | +5.5% |
| KenmoreSchool here | $1,410,000 | $620,000 | +8.1% |
| Chapel Hill | $1,655,000 | $620,000 | +10.9% |
| Brookfield | $1,800,000 | $720,000 | +5.0% |
| Fig Tree Pocket | $1,895,000 | $720,000 | -2.8% |
| Pullenvale | $2,255,000 | $720,000 | +1.7% |
Medians are indicative — recently published anchors where available, otherwise modelled and calibrated against the ABS Residential Property Price Index. For a property-level figure, request a free valuation.
Suburbs in the Kenmore SHS catchment
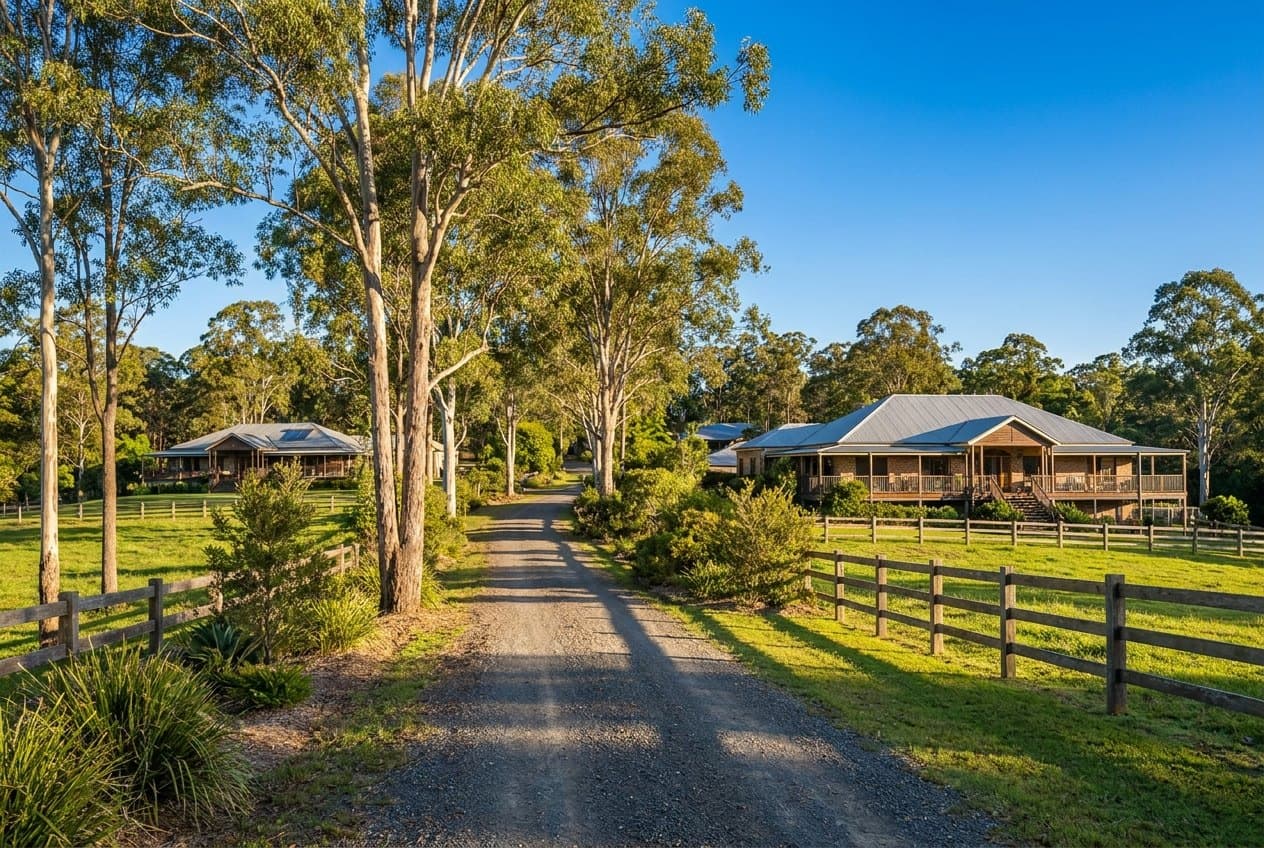 4070
4070Moggill
+6.0% YoY
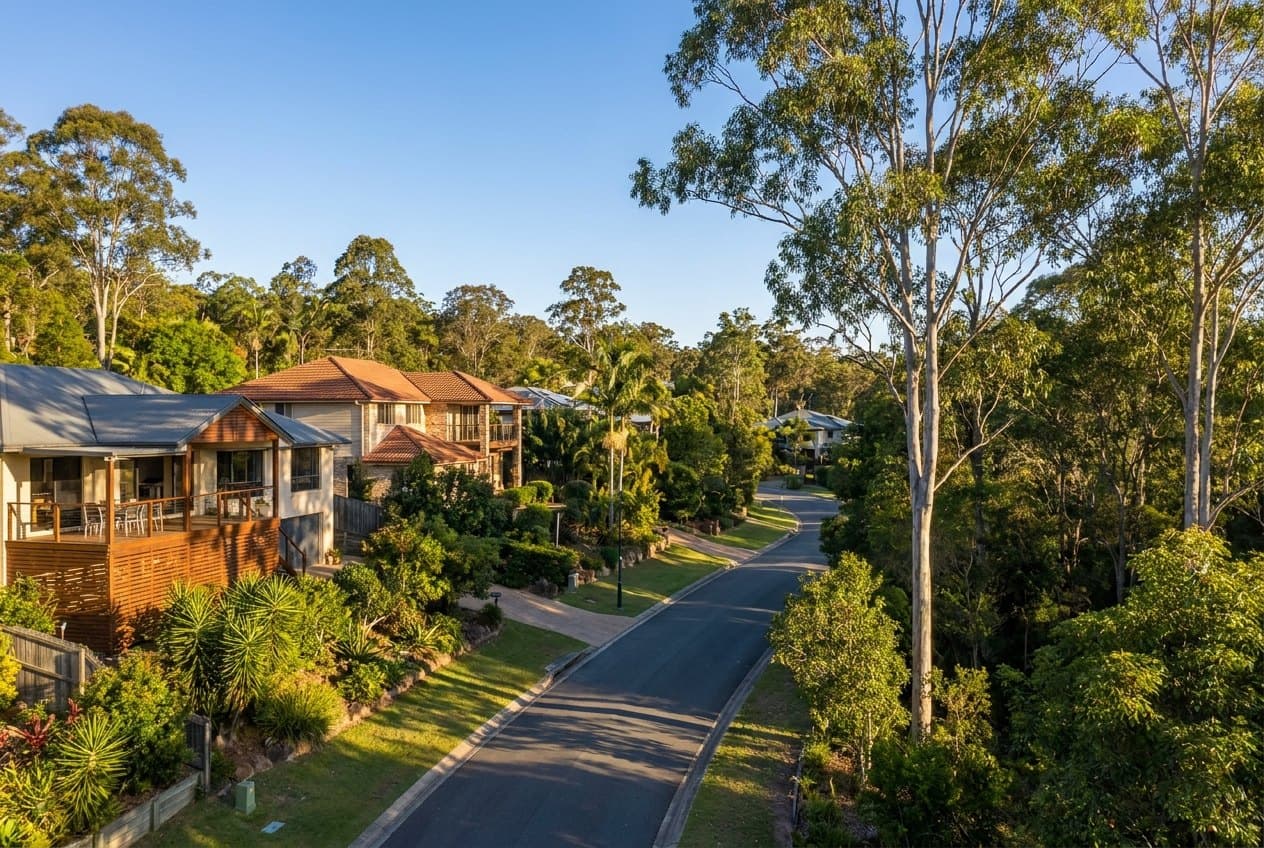 4070
4070Bellbowrie
+6.0% YoY
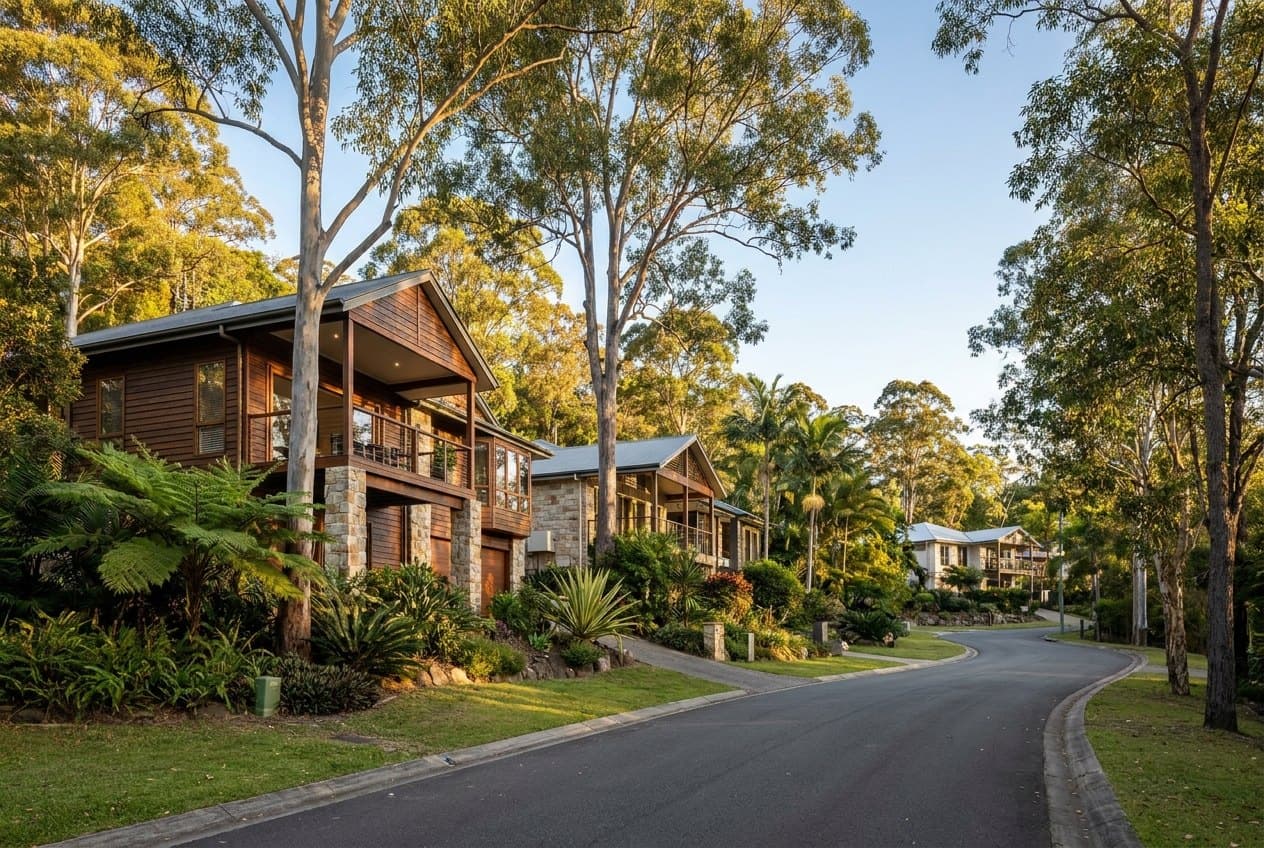 4069
4069Kenmore Hills
+5.5% YoY
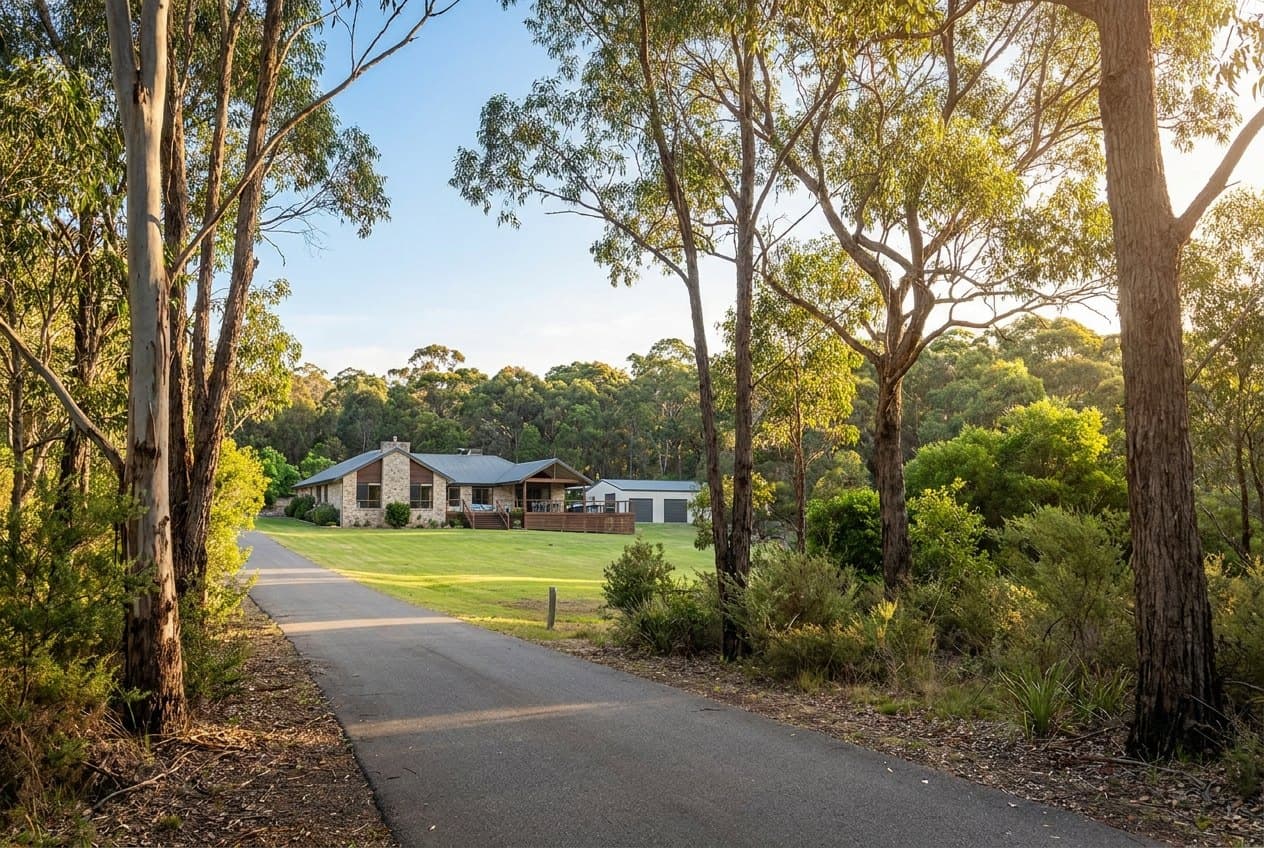 4070
4070Anstead
+5.5% YoY
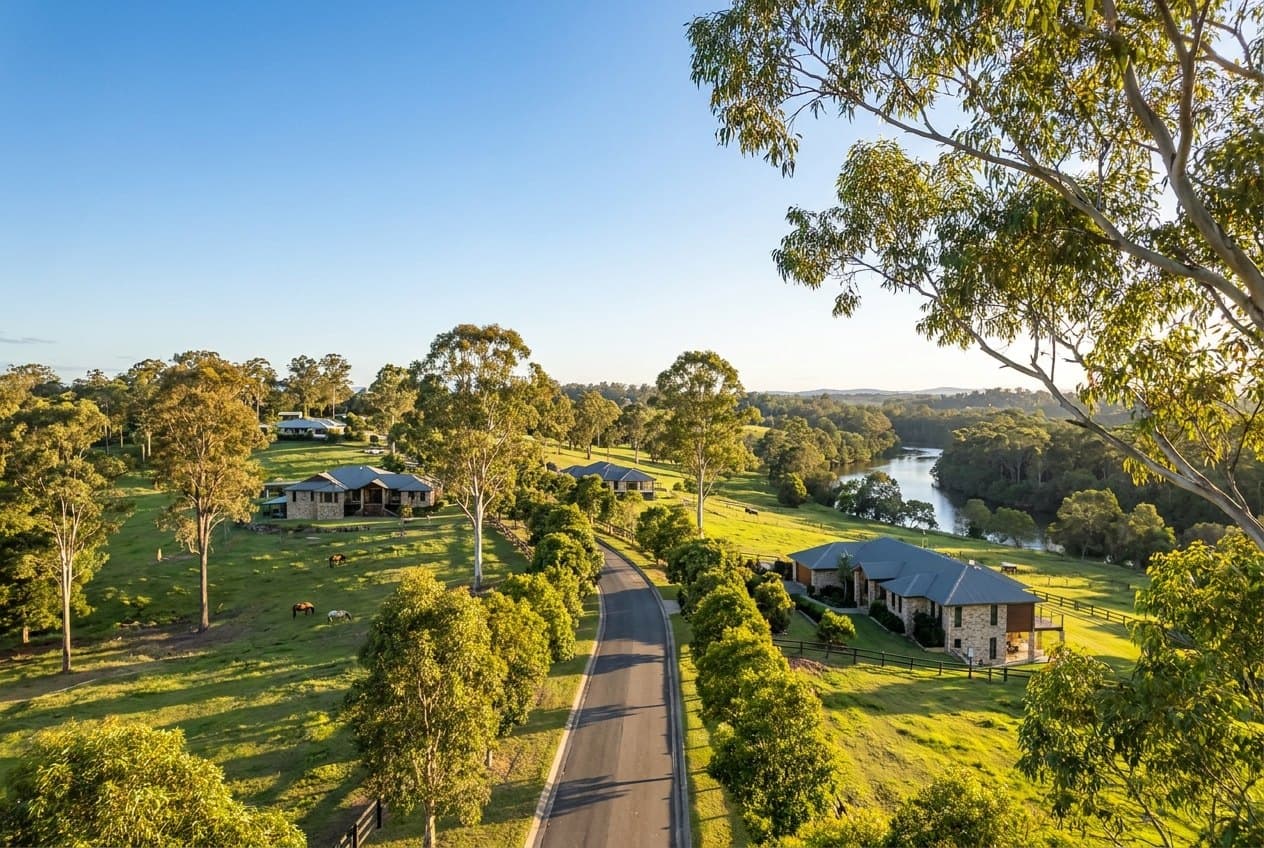 4069
4069Pinjarra Hills
+5.5% YoY
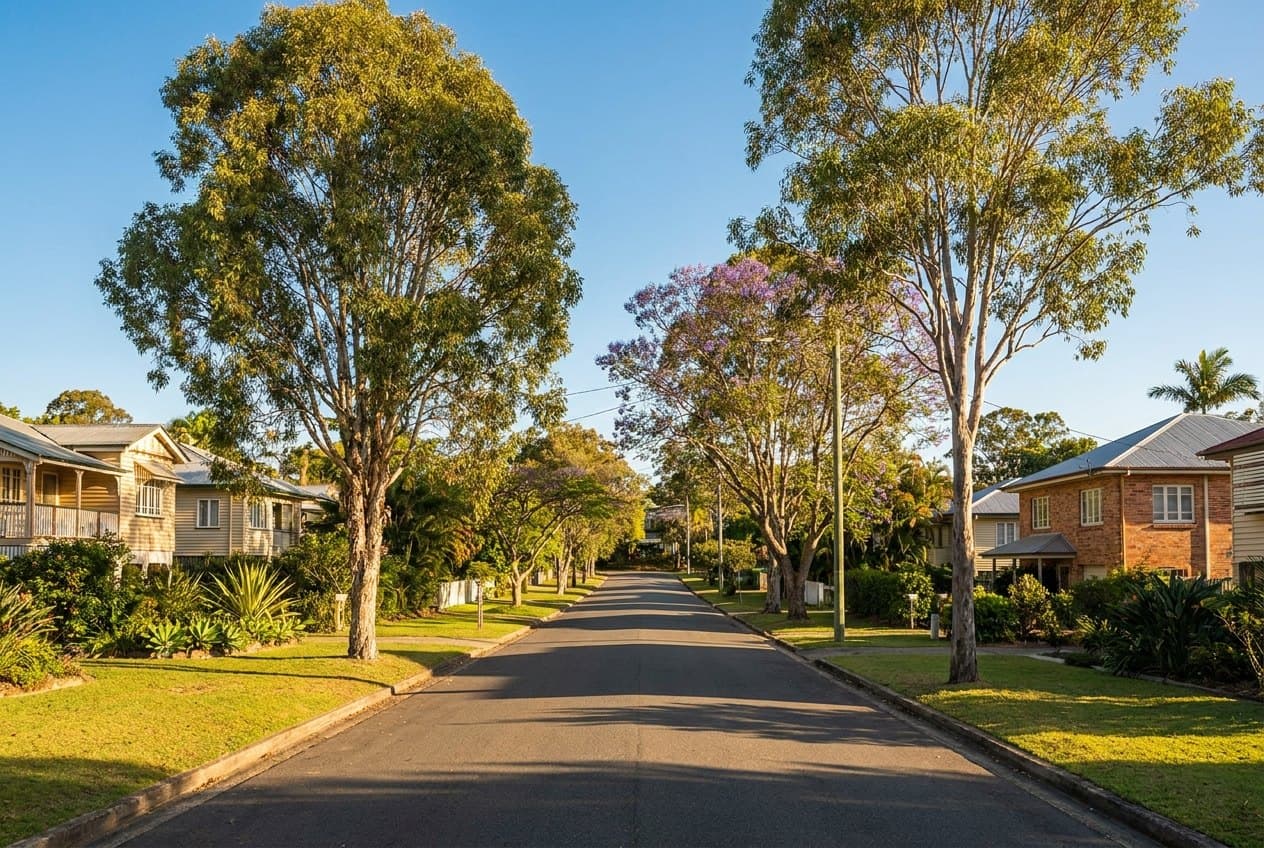 4069
4069Kenmore
+8.1% YoY
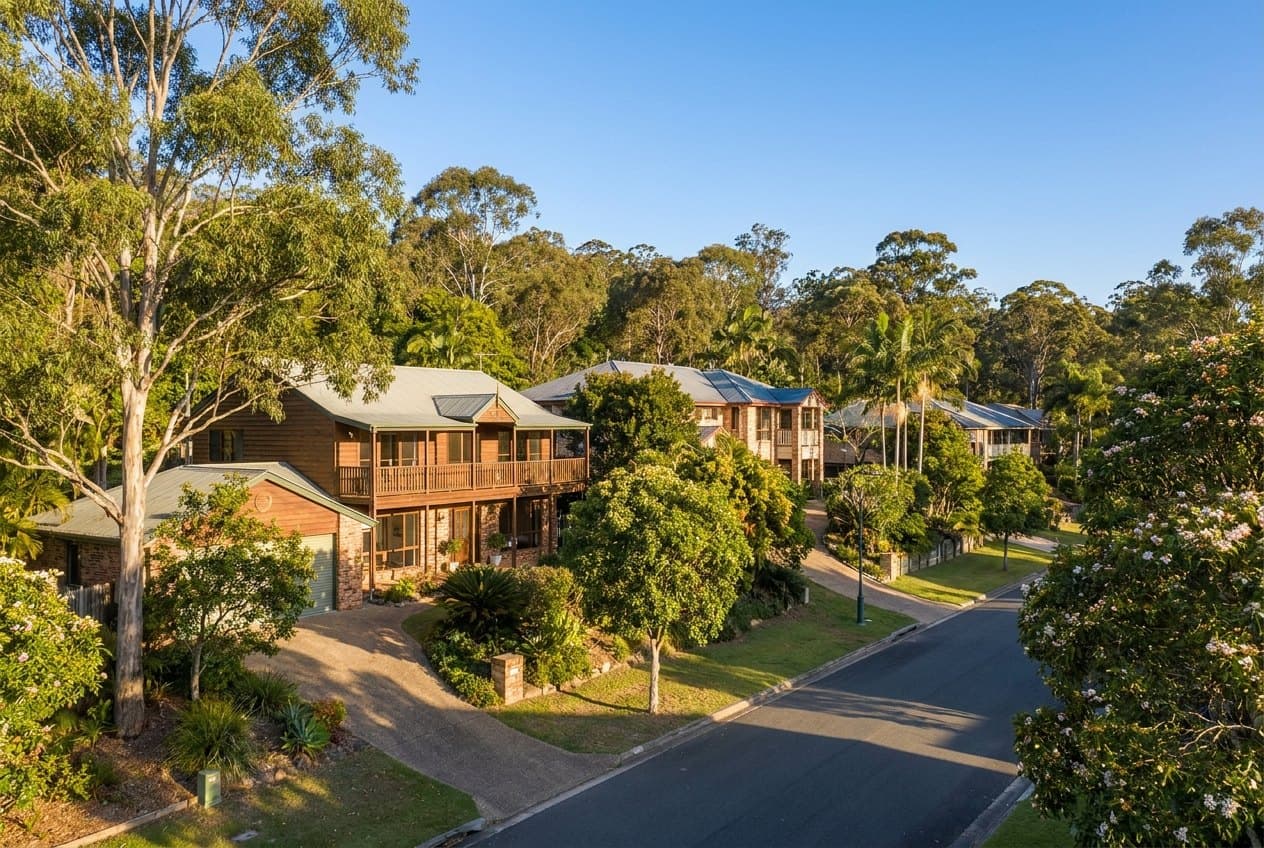 4069
4069Chapel Hill
+10.9% YoY
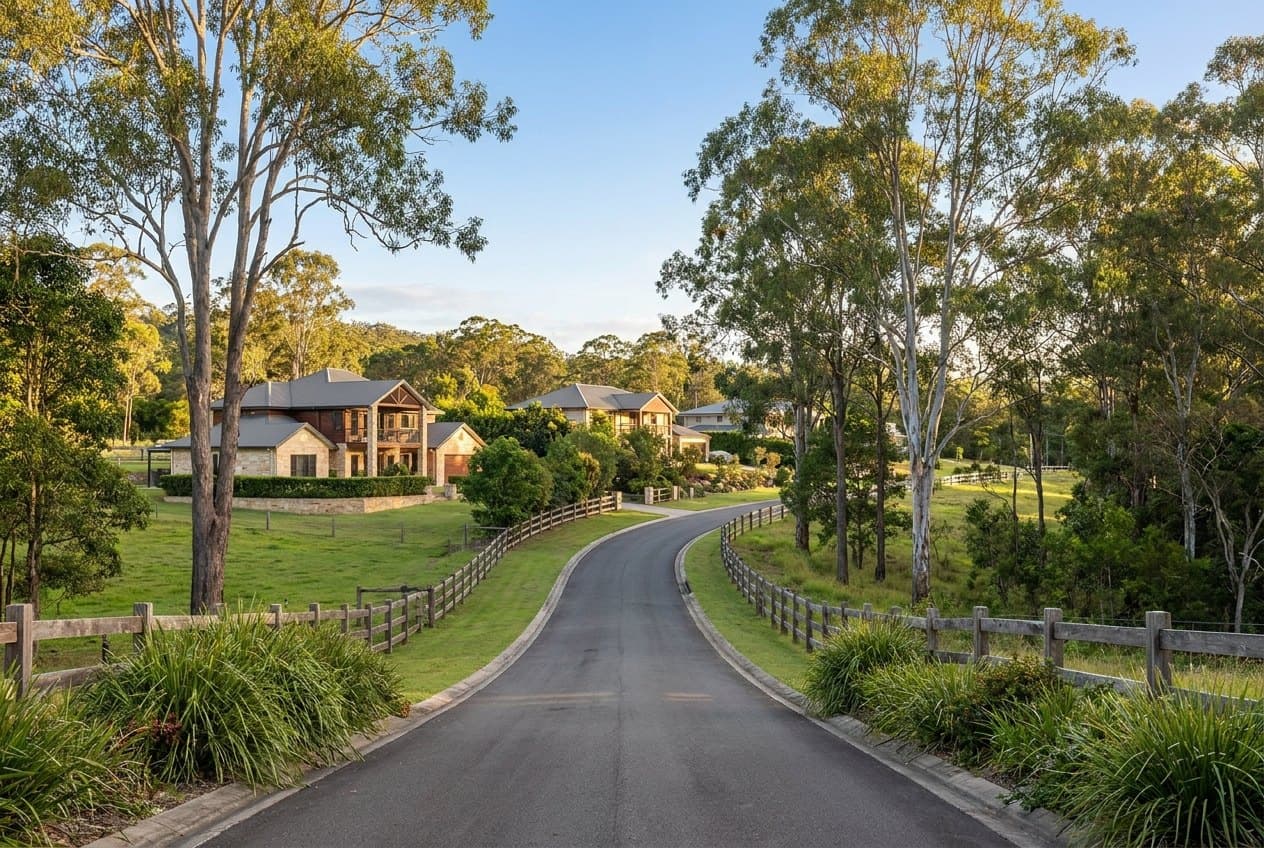 4069
4069Brookfield
+5.0% YoY
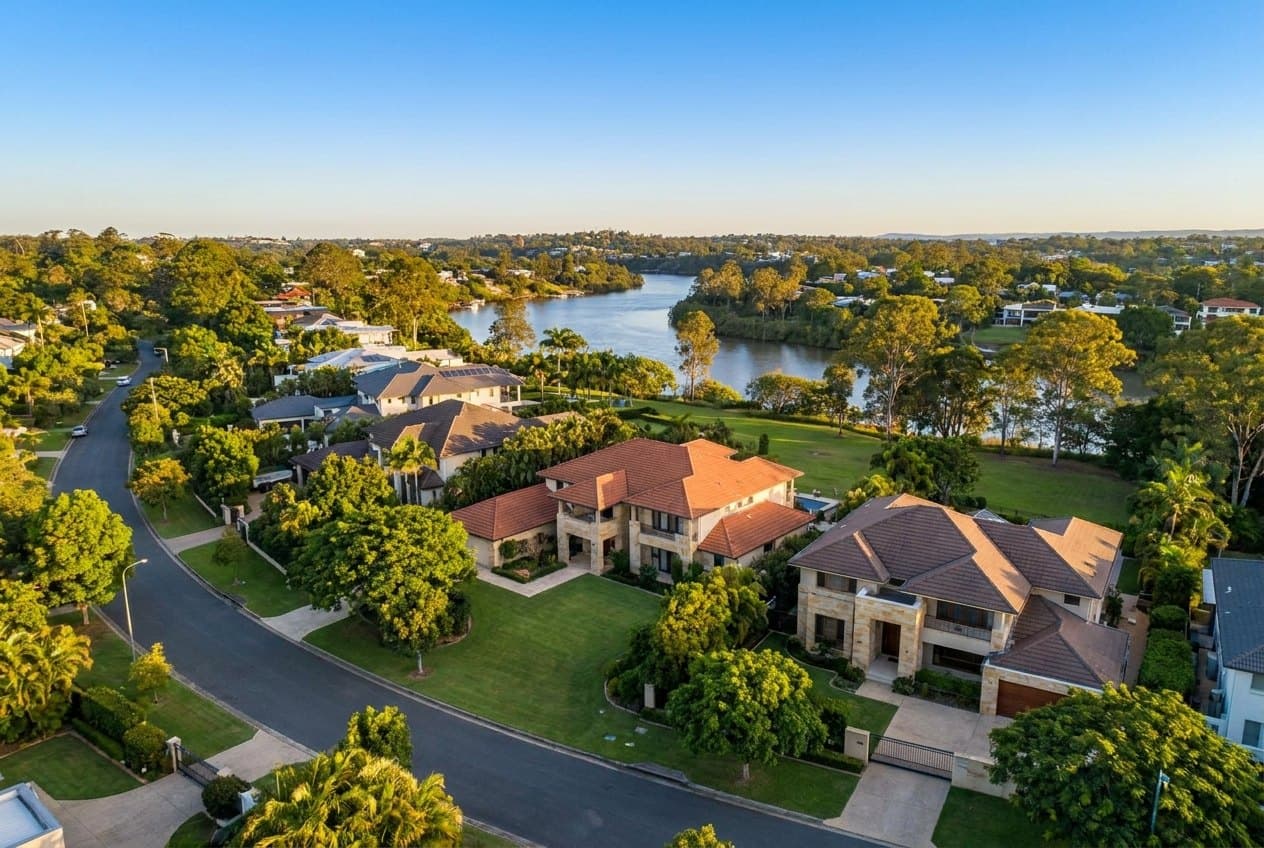 4069
4069Fig Tree Pocket
-2.8% YoY
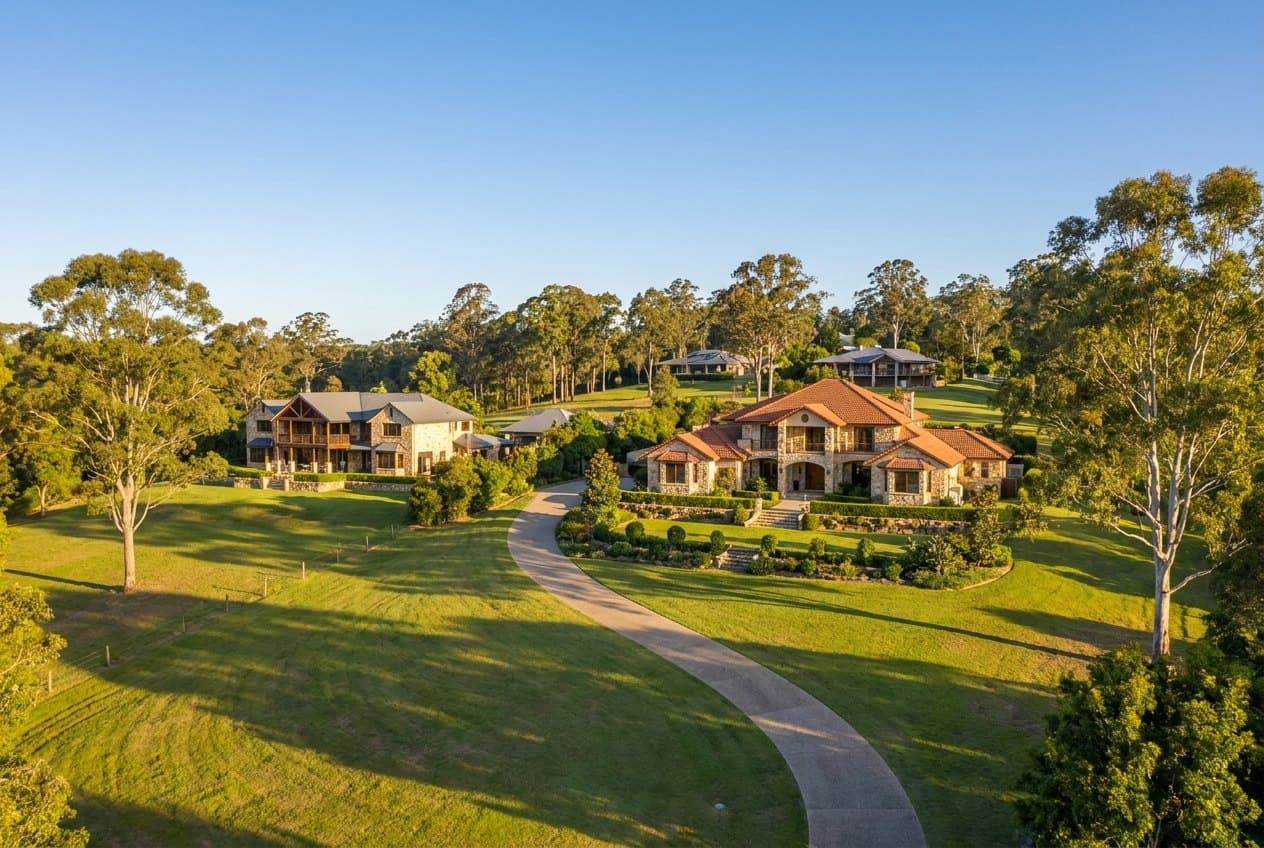 4069
4069Pullenvale
+1.7% YoY
Always confirm the boundary. Catchment lines are set by the Queensland Department of Education and can change each year — they can even split a single street. Check the exact address on the Queensland Government’s official catchment finder before you buy. Brisbane House Prices is a property-price guide, not an enrolment authority.
Questions about the Kenmore SHS catchment
Buying into the Kenmore SHS catchment?
Get a free, data-backed valuation on any home in the zone. Two minutes, no sign-up.